

The possibility of making money through sports betting attracts thousands of people. Telegram groups share betting tips, specialized websites publish analyses, and tipsters present their recommendations as opportunities to find profitable outcomes. With so much information available, it may seem that all you need to do is study the games, identify good odds, and follow a consistent strategy to turn betting into a source of income.
But does this perception hold up when we analyze thousands of bets instead of looking at just a few wins?
To investigate this question, I conducted a personal experiment involving 3,823 bets recorded over approximately one year. The bets were placed based on tips from third parties, information from specialized websites, and my own analyses, without any claim of using professional methods.
The goal was to track the financial results and understand what the numbers reveal about the attempt to make a profit through sports betting.
The experience led to an important finding: a betting bankroll can experience significant periods of growth and still end up with a negative cumulative result.
In this article, we will analyze the data, explore the mathematical concepts behind betting odds, and discuss why winning bets is not enough to demonstrate that a strategy is profitable.
1. How Was the Experiment Conducted?
The experiment was conducted between April 18, 2023, and April 20, 2024, with 3,823 bets recorded across different matches and sports betting markets.
The initial bankroll was R$1,000, and the nominal amount recorded per bet was R$20. Betting decisions were based on three main sources:
- Tips and recommendations found in Telegram groups.
- Information and analyses consulted on specialized websites.
- My own analyses, conducted by someone without professional experience in the betting market.
The websites consulted included ApostaganhaBR, Aposta10, APWin, and Academia das Apostas Brasil.
It is important to clarify that this was not a controlled scientific experiment. There was no random selection of bets, no comparison with a control group, and no complete record of all the information needed to evaluate each source of betting tips individually.
This is a personal case study aimed at examining the observed results and using mathematics to better understand the risks involved.
This distinction is essential: the data allow us to analyze what happened with this specific strategy, but they do not automatically represent the behavior of all bettors.
2. What Do the Numbers Show?
The first step in data analysis is to examine the distribution of results and calculate the most relevant financial indicators. Download the dataset here.
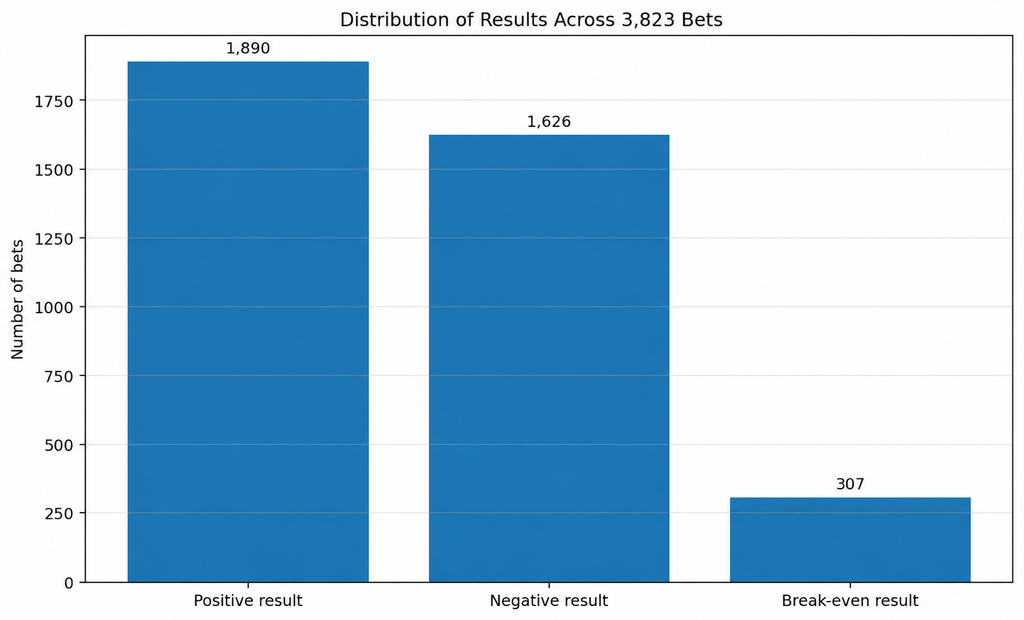
The spreadsheet shows the following distribution:
| Indicator | Result |
|---|---|
| Total bets | 3,823 |
| Positive results | 1,890 |
| Negative results | 1,626 |
| Break-even results | 307 |
| Initial bankroll | R$1,000.00 |
| Highest recorded bankroll | R$1,659.00 |
| Final recorded bankroll | −R$169.80 |
Positive results account for approximately 49.4% of all bets. If we consider only bets that ended with a positive or negative result, excluding the 307 bets that broke even, the proportion of positive results rises to approximately 53.8%.
At first glance, these numbers may seem reasonable. After all, there were more positive results than negative results among the bets that actually made or lost money.
But there is a fundamental difference between achieving positive results and generating a financial profit.
A winning bet may produce a small gain, while a losing bet may consume the entire amount wagered. In addition, different sports betting markets may have different settlement rules, including partial refunds and bets that end with no financial gain or loss.
Therefore, counting wins and losses is not enough to determine whether a strategy is profitable.
The most important indicator is the cumulative financial result relative to the amount wagered.
Distribution of Results
The chart below shows how many bets ended with positive, negative, or break-even results.
3. What Is ROI, and Why Does It Matter?
ROI stands for Return on Investment. In sports betting, we can use it to relate the net financial result to the total amount wagered.
The formula is:
ROI = Net financial result ÷ Total amount wagered × 100
Considering 3,823 bets of R$20 each, the nominal total amount wagered was:
3,823 × R$20 = R$76,460.
When we add up the individual results recorded in the spreadsheet, we arrive at a loss of R$1,148.80.
Using these figures, the ROI calculated from the individual results is:
ROI = (−R$1,148.80 ÷ R$76,460.00) × 100 = −1.50%
Approximate ROI: −1.50%.
This means that for every R$100 in nominal betting volume, the average observed result was a loss of approximately R$1.50.
It is important to interpret this indicator correctly. The R$76,460 represents the cumulative betting volume, not the amount of capital that needed to be available simultaneously. The same money may have been used for multiple bets throughout the period.
It is also necessary to note a limitation in the spreadsheet: the sum of the individual results indicates a loss of R$1,148.80, while the cumulative bankroll column implies a loss of R$1,169.80 when the initial bankroll of R$1,000 is taken into account. There is therefore a discrepancy of R$21 between the records.
For transparency, the ROI above was calculated using the sum of the individual results. The final bankroll balance should be presented as the value recorded in the spreadsheet, rather than as a balance reconciled with that sum.
Despite this discrepancy, both records point in the same direction: the experiment ended with a negative financial result.
4. The Illusion of Profit Peaks
One of the most interesting aspects of the experiment is how the bankroll evolved over time.
At one point, the recorded balance reached R$1,659, representing an increase of 65.9% compared with the initial bankroll of R$1,000.
For someone following only that period, it would have been easy to conclude that the strategy was working.
A sequence of positive results can reinforce confidence in one’s own analyses, the recommendations received, and the ability to identify good opportunities.
However, a profitability peak does not represent the final result of the experiment.
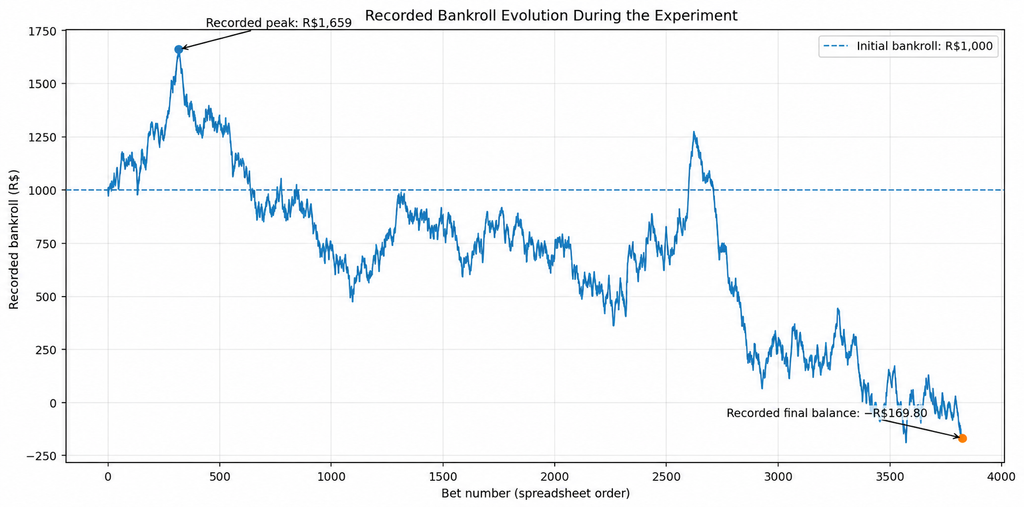
The bankroll evolution chart helps visualize the difference between the highest recorded balance and the result at the end of the period.
This phenomenon deserves attention because people tend to place considerable importance on recent results and events that confirm their expectations. When a series of bets generates profits, it can create the impression that a special skill or a strategy capable of generating continuous profits exists.
The problem is that favorable results can also occur due to random variation.
In a process involving many outcomes, it is possible to observe winning streaks, periods of rapid growth, and downturns. The existence of a positive streak, by itself, does not establish whether a genuine mathematical edge exists.
The same reasoning applies to financial markets, games of chance, and other contexts in which uncertain outcomes are observed over time.
To evaluate a strategy, we must consider the full set of results, the risk taken, and whether there is evidence that the strategy can generate positive returns sustainably.
A profit peak shows that a favorable period occurred. On its own, it does not demonstrate that the method used has a persistent edge.
5. Why Winning More Bets Does Not Guarantee a Profit
To understand this point, we need to analyze the relationship between odds, probabilities, and financial returns.
Odds represent the price offered for a particular outcome. With decimal odds, the payout from a winning bet equals the stake multiplied by the odds, including the return of the original stake.
For example, imagine a R$100 bet at odds of 2.00.
If the bet wins, the total return will be R$200, of which R$100 is the original stake and R$100 is profit.
If the bet loses, the loss will be R$100.
In this simplified example, the win rate required to break even is 50%, provided that all bets have the same odds and stake and there are no refunds.
But now imagine that the odds are 1.50.
A winning R$100 bet generates R$50 in profit. A losing bet generates a R$100 loss.
In this case, winning half of the bets would not be enough to make a profit.
The minimum win probability required to break even is calculated using the formula:
Break-even probability = 1 ÷ odds
For odds of 1.50:
P = 1 ÷ 1.50 = 0.6667 = 66.67%
This means that, in this simplified scenario, you would need to win more than 66.67% of your bets to make a profit in the long run.
| Decimal Odds | Break-Even Probability |
|---|---|
| 1.50 | 66.67% |
| 1.80 | 55.56% |
| 2.00 | 50.00% |
| 2.50 | 40.00% |
| 3.00 | 33.33% |
These percentages are mathematical break-even points, not performance forecasts. The calculation assumes constant odds and no refunds, and it does not account for outcome variability.
The conclusion is simple: winning bets is not enough. You must win enough relative to the odds offered to compensate for your losses.
6. How Do Sportsbooks Build a Margin Into Their Odds?
Sportsbooks do not need to predict every sporting outcome perfectly to operate a sustainable business. One of the mechanisms they use is incorporating a margin into the odds they offer.
Imagine a hypothetical match between two teams, A and B, with a true probability of victory of 50% for each team.
If the odds were perfectly fair, both teams would have odds of 2.00.
However, suppose the sportsbook offers odds of 1.90 on each team to win.
The implied probability of a set of odds is calculated by dividing 1 by the odds value.
For each team:
P = 1 ÷ 1.90 = 0.5263 = 52.63%
Adding the implied probabilities of both outcomes:
52.63% + 52.63% = 105.26%
The total exceeds 100%. This difference is known as the overround and represents the gross margin built into the offered prices.
This does not mean that the sportsbook will necessarily earn exactly 5.26% on every match. The actual outcome depends on factors such as the distribution of bets, market settlement rules, and risk management.
The example does, however, demonstrate that the odds offered do not have to correspond to the fair probabilities of the outcomes.
For bettors, this creates a mathematical obstacle: to make a consistent profit, it is not enough to estimate reasonable probabilities. You must identify opportunities where the true probability of an outcome is higher than the probability implied by the odds, by a sufficient margin to compensate for the risks and the market’s built-in margin.
This challenge helps explain why consistently beating sportsbooks is difficult.
It is not mathematically impossible to beat the odds offered. But claiming that a strategy has an edge requires evidence, not just a winning streak.
7. What Does Statistics Teach Us About Sports Betting?
The experiment allows us to discuss several important statistical concepts.
Outcome Variability
Even when a process has no positive edge, its results can fluctuate considerably.
A winning streak can quickly increase the balance, while a losing streak can eliminate a significant portion of previous gains.
Variability explains why short periods can create an impression that differs from what we observe across the entire experiment.
Sample Size
Analyzing thousands of bets is more informative than evaluating just a few selected wagers.
If someone presents five winning bets, we do not have enough information to conclude that a profitable strategy exists. We also need to know about the losing bets, the amounts involved, and the cumulative result.
In this experiment, the 3,823 bets provide a much broader view of the strategy used than a collection of successful betting tips would.
However, sample size does not eliminate every limitation. Bets may be correlated, and sports betting markets may have different characteristics. Furthermore, the lack of complete odds data and detailed records about the sources prevents a more in-depth evaluation.
Observed Results Do Not Guarantee Future Results
A negative result does not prove that every possible strategy will lose money. Similarly, a positive result does not prove that a strategy will remain profitable.
Statistics helps us distinguish what was actually observed from what we would like to conclude from the data.
In sports betting, the most relevant question is not simply whether someone made money during a particular period, but whether there is evidence that their decisions provide a genuine edge over the odds offered.
That edge must be demonstrated consistently, without relying solely on the best results observed.
The Cumulative Trajectory of Results
In addition to analyzing the number of positive and negative bets, we can examine how the results accumulate over time.
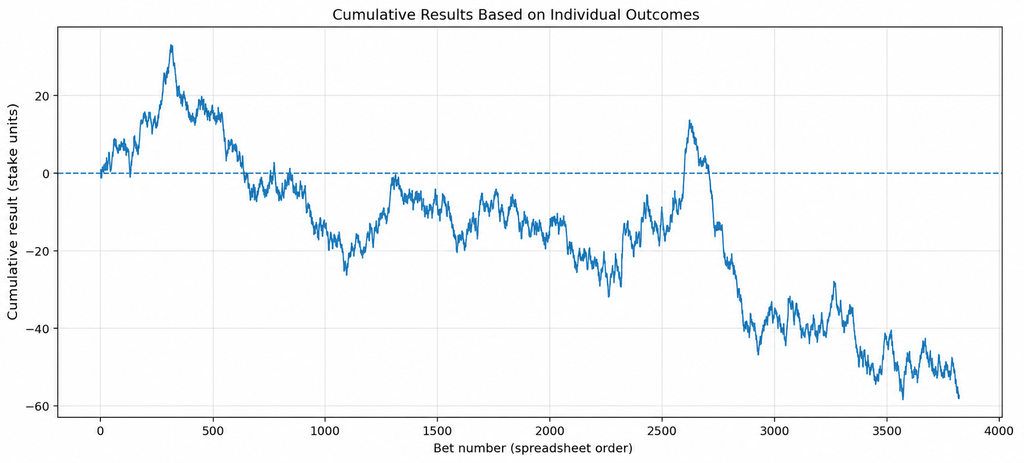
This visualization makes it possible to investigate periods when cumulative results improved or deteriorated. It complements the bankroll chart, although it uses a different basis: the progressive sum of individual results, expressed in stake units.
8. The Role of Tipsters and Personal Analysis
During the experiment, betting decisions were based on a combination of third-party recommendations, information from specialized websites, and my own analyses.
This is understandable behavior. When people want to make decisions in a complex environment, it is natural to seek experts, monitor indicators, and look for information that might improve their choices.
The problem arises when the existence of a recommendation is confused with the existence of a mathematical edge.
A well-researched tip can still result in a loss. A winning streak can occur without a persistent edge. A personal analysis may seem convincing while being based on poorly estimated probabilities.
To evaluate a tipster or a source of betting tips individually, we would need a complete history of recommendations, including the odds available when each tip was published, timestamps, markets, results, selection criteria, and any changes to the recommendations.
Since the experiment does not contain all these records, it would be incorrect to attribute the losses specifically to the tipsters, the websites consulted, or the personal analyses.
What we can say is that the combination of these sources did not generate a cumulative profit in the experiment analyzed.
9. What Does This Experiment Demonstrate — and What Does It Not?
It is important to establish the limits of our conclusions.
The experiment demonstrates that a personal strategy, built from third-party tips and personal analyses, experienced periods of significant bankroll growth but ended with a negative financial result in the available records.
It also illustrates how the win rate can be insufficient to evaluate profitability and how the margins built into odds represent an obstacle for anyone trying to make a profit.
On the other hand, the study does not demonstrate that all bettors will lose money, that no strategy can beat sportsbooks, or that all tipsters produce negative results.
Answering these questions comprehensively would require more complete data and a methodology capable of evaluating different bettors and strategies.
This caution does not weaken the analysis. On the contrary, it is an essential part of a data-driven approach: recognizing what the evidence allows us to claim and avoiding conclusions that go beyond the scope of the experiment.
10. Conclusion: Winning Some Bets Is Not the Same as Having a Winning Strategy
The experiment began with a bankroll of R$1,000 and recorded a peak of R$1,659. At one point, therefore, the balance was 65.9% above the initial capital.
Despite this favorable period, the records ended with a negative cumulative balance.
The experience illustrates a fundamental distinction: making a temporary profit is not the same as demonstrating that a strategy is profitable.
The number of wins, confidence in a tipster, the apparent quality of an analysis, and the best periods of bankroll performance are not enough to prove a mathematical edge.
Odds incorporate margins that make consistent profits more difficult to achieve, and bettors must overcome this obstacle to demonstrate that they have a genuinely advantageous strategy.
The most important lesson is not that making money through sports betting is impossible. It is that we should not confuse favorable results with evidence of a sustainable edge.
From a Data Science perspective, conclusions must be based on the complete set of records, an analysis of the results, and an acknowledgment of the existing limitations.
Ultimately, the most important question is not how much we managed to win during our best period, or how many bets we won. It is whether the data demonstrate that our decisions can produce a genuine and persistent edge over the available odds.
Without such evidence, a period of success may represent nothing more than a favorable run — not a reliable source of income.